The Ozone Hole
The history of ozone depletion provides parallels to global warming today and offers insight and inspiration on how to move forward. In the 1980s, ozone depletion was being described as the most important environmental issue to face the planet. Ozone in the upper atmosphere provides a critical protective layer between all biological life and the very high energy and damaging ultraviolet light from the sun. In 1985, the discovery of the Antarctic ozone hole became a symbol, both real and frightening, for how humans can inadvertently alter their environment in ways that can affect all life. (The accompanying graphic shows a satellite view of the Antarctic ozone hole in September 2006. (Blue and purple indicate low ozone values.)
Within a few years of this discovery, it was confirmed that chlorofluorocarbons (CFCs), a class of chemicals entirely manufactured by humans, were destroying large amounts of ozone. With strong scientific backing and little resistance from industry, international action to reduce the use of ozone-depleting substances moved swiftly. The Montreal Protocol (1987) agreed to reduce ozone-depleting substances using a step-by-step approach that allowed developing countries more time to convert their technologies.
Today, CFC production is almost completely phased out, and with the decline of CFCs in the atmosphere, we expect to see a gradual recovery in global ozone and a filling in of the ozone hole during the next fifty years.1 Today’s story of ozone depletion suggests a happy ending , provided that we continue to follow the steps outlined in the Montreal Protocol. If controls on ozone-depleting gases had not been enacted, global ozone levels by 2050 would have been up to 30 percent lower than today, with accompanying rises in cataracts, skin cancer, and damage to animals and crops.2 While global warming is scientifically a completely different issue, there are parallels. The science relating to climate change has become solid over the last decade. We understand that rising levels of greenhouse gases are responsible for most of the recent warming, and that if we don’t reduce emissions, temperatures will continue to warm. We also realize that solutions exist today that can reduce our emissions without compromising our quality of life. If we follow the same model used for ozone depletion and work together as a society, then we can also imagine a happy ending to the issue of global warming.
References
1. V . Eyring, et al., “Multimodel Projections of Stratospheric Ozone in the 21st Century,”Journal of Geophysical Research-Atmospheres, 112 (Aug. 2007), D16303 (article number).
2. For a good review of the current status of the ozone layer, see the most recent version of the World Meteorological Organization/United Nations Environment Programme’s Ozone Assessment (2006). The “Twenty Questions and Answers” section provides a relatively quick update and details can be found in the report. Connections between global warming and ozone depletion are addressed particularly in chapter 5: Climate Ozone Connections, https://library.wmo.int/pmb_ged/gormp_50-faq_en.pdf. For a shorter review of ozone changes in the coming decades, see A. Tabazadeh and E. C. Cordero, “New Directions: Stratospheric Ozone Recovery in a Changing Atmosphere,”Atmospheric Environment, 38 (2004), 647-49.
Why would a few degrees of warming be a big deal?e
Because we all experience temperature changes of tens of degrees every day, a few degrees of global warming may not seem like a lot. A few degrees of change in the global surface temperature can, however, indicate a drastic change in the Earth’s climate. This can be exemplified by considering climate changes of the past. The last ice age, for example, was characterized by permanent glaciers over much of North America and Eurasia despite the fact that the Earth was only 5°C-8°C cooler than today. Also, more recent fluctuation in global climate over the last 2000 years have been characterized by temperature swings of only ~0.5°C but have had large enough effects to receive names like the “Medieval Warm Period” and the “Little Ice Age”.
We have experienced only about 0.8°C of warming since the 19th century but the effects are already detectible on many natural systems (IPCC, 2007). Furthermore, this 0.8°C change is small compared to the warming projected for the remainder of the 21st century (figure 1). It is difficult to predict the exact consequences of such warming but studies suggest that more negative outcomes will be seen as more warming occurs (figure 2).
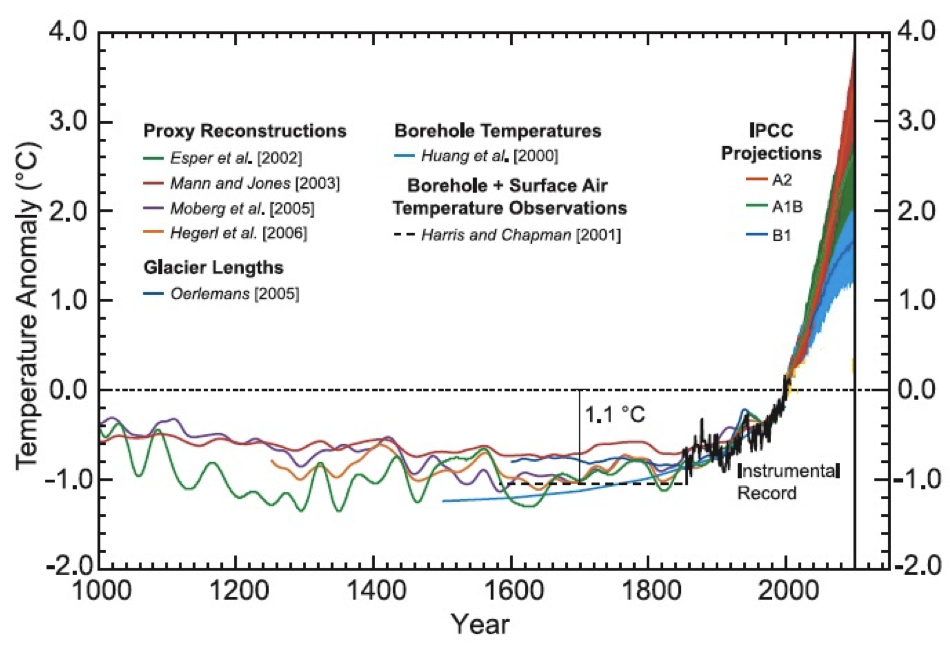
figure 1 – Projected global warming over the next century in the context of climate change over the past 1000 years. Future projections differ depending on estimated changes in human greenhouse gas emissions. (figure source: Chapman and Davis, 2010)
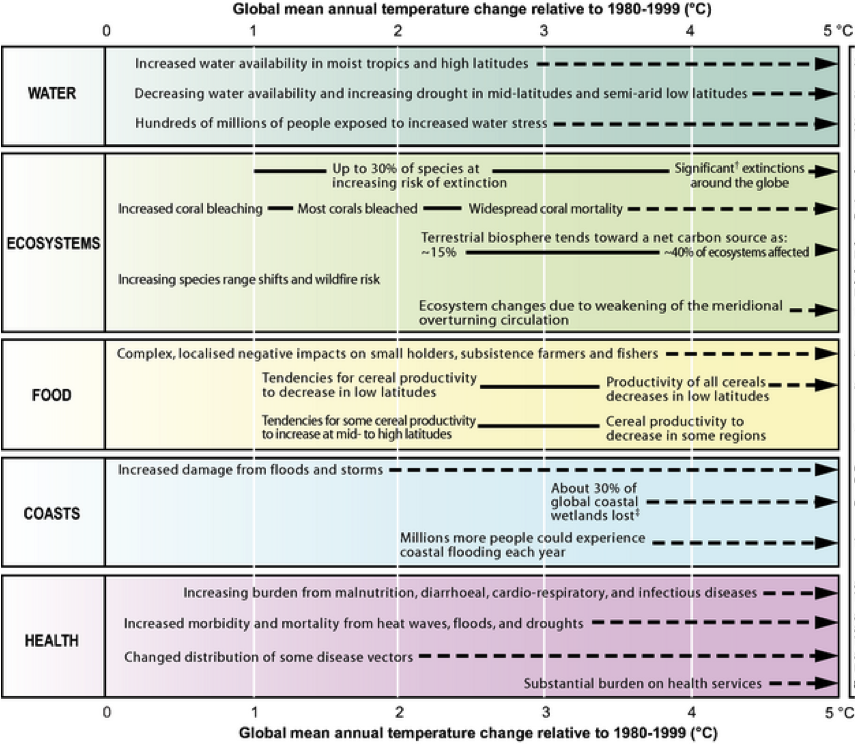
figure 2 – Expected consequences of climate change as a function of future warming (Source)
References:
Chapman D. S., and M. G. Davis (2010) Climate Change, Past, Present, and Future, EOS Vol. 91, No. 37, 325-332
IPCC, 2007: Summary for Policymakers. In: Climate Change 2007: Impacts, Adaptation and Vulnerability. Contribution of Working Group II to the Fourth Assessment Report of the Intergovernmental Panel on Climate Change, M.L. Parry, O.F. Canziani, J.P. Palutikof, P.J. van der Linden and C.E. Hanson, Eds., Cambridge University Press, Cambridge, UK, 7-22.
Further Reading:
IPCC Climate Change 2007: Working Group II: Impacts, Adaption and Vulnerability Magnitudes of impact
Hasn’t climate changed before?
This episode explains when and how the climate has changed before and how it differs from current climate change.
Topics covered in this video:
0:00-1:12
-Introduction (Yes!)
1:13-2:48
-Measurements of CO2 content from 400 million years: relationship to glaciers and temperature
2:49-4:50
-More recent temperature oscillations (500,000 year timeline) due to Milankovitch cycles
-CO2 effect on intensity of temperature change
4:51-6:03
-1200 year timeline
-Tree ring width, chemical signatures in ice cores, and meteorological records
6:04-7:07
-Logic of past climate changes and current climate change causes
What would cause Earth’s temperature to change?
This episode explores the factors that would cause the Earth’s climate to change.
Topics covered in this video:
0:00-0:45
-Introduction
0:45-2:50
-Fundamentals of Physics: Temperature
-Energy Budget
2:51-5:45
-Family Budget Analogy (Income Earnings and Spendings)
5:46-6:41
-Earth’s system relationship to family budget analogy
-Incoming solar radiation vs. infrared radiation
Why don’t CO2 and temperature correlate perfectly?
This episode discusses the factors that explain why carbon dioxide and temperature don’t correlate perfectly.
Topics covered in this video:
0:00-1:27
-Global Temperature and CO2 graphical representation
-Decade to Decade time scale variability
1:28-4:06
-Graphs of isolated scenarios for temperature change (Anthropogenic greenhouse gases, Anthropogenic Aerosols, Volcanic Aerosols, and Solar radiation)
-Graphs of all influences combined
4:07-7:34
-Internal Variability (changes in ocean heat absorption)
-Fictional Example of isolated Internal Variability and example with combined Greenhouse Gases
Introduction to Earth’s Climate System
This episode defines climate and weather, and provides a brief introduction to climate change.
Topics covered in this video:
0:00 – 2:55
– Difference between climate and weather
– Why is climate so difficult to understand?
2:56 – 6:07
– How climate changes naturally (e.g. ice ages)
– How humans have changed land use (e.g. pastures and croplands)
6:08 – 8:52
– Average world temperarture and sea level
– Arctic sea ice and ice proxies
8:53 – 12:00
– CO2 concentrations
12:01 – 12:33 (end)
– Greenhouse gases N2O, CH4
– Overview of how all 3 gases (CO2, N2O, CH4) show the same exponential increase with human population
– Ice cores
Earth’s Energy Balance
This episode examines how the Earth’s atmosphere transmits electromagnetic radiation, and how certain molecules in the atmosphere cause we we call the greenhouse effect.
Topics covered in this video:
0:00 – 0:34:
– Introduction
0:35 – 5:07
– Earth’s energy budget
– Albedo
– Incoming energy balances with outgoing energy at all levels of the atmosphere (top of atmosphere, middle of atmosphere, Earth’s surface)
– Units of W/m^2
5:08 – 8:38
– Changing the Earth’s Energy Budget
– Scenario 1: No greenhouse gases
– Scenario 2: Greenhouse gases increase by 50%
8:39 – 12:35 (end)
– Comparing Venus and Earth -Differences in albedo, surface temperature, and mass of atmosphere
– Why is Venus’s surface temperature so much higher than Earth’s?
– Runaway greenhouse effect
Complex Systems and Feedbacks
This episode investigates systems and feedbacks to understand how climate operates.
Topics covered in this video:
0:00 – 3:28
– What is a complex system?
– Linear vs non-linear
3:29 – 8:53
– Equilibrium and stability
8:54 – 12:17
– Feedbacks (positive and negative)
– Examples of feedbacks
12:18 – 19:10 (end)
– Climate forcings and feedback loops
– Feedback examples: ice-albedo, cloud coverage, bobcats and rabbits
The Sun, Energy & Radiation
This episode provides an introduction to the sun, energy and radiation.
Topics covered in this video:
0:00 – 4:00
– The sun (radiation and plasma)
– Solar flares
4:01 – 6:44
– Calculation of the time it takes for plasma from the sun to reach the earth
– Equation: v = d/t
– Scientific notation
6:45 – 8:43
– The effects of solar plasma on Earth and humans:
– Auroras
– Fried electronics (electrical outages)
– Possible climate impacts (sunspots)
8:44 – 13:22 (end)
– Radiation: – Energy transfer: conduction, convection & radiation
– Electromagnetic radiation (e.g. radio waves, microwaves)
– Wavelength (lambda)
– Electromagnetic spectrum
– Shorter wavelength, more energy
– Stefan-Boltzmann
– Weins Law and an example
Earth’s Atmosphere
This episode investigate the composition of the atmosphere, its layers: troposphere and stratosphere, and how they make life in earth possible.
Topics covered in this video:
0:00 – 3:17
– Composition of the earth’s atmosphere
– Gases: N2 (78%), O2 (21%), other (1%)
– Other gases: CO2, O3, Ne, He, CH4, etc.
– Layers of the Atmosphere
– Stratosphere: O3 layer, CFCs
– Sroposphere: ~12 km thick
3:18 – 5:34
– How radiation gets through the atmosphere
– Sun’s radiation: insolation = INcoming SOLar radiATION
– Earth’s radiation: Infrared (IR)
– Greenhouse gases absorb earth’s IR and reemit
5:35 – 8:10
– Earth’s average temperature
– Blackbody radiation
– Greenhouse effect: list and flowchart
8:11 – 10:18 (end)
– Surface Energy Budget
– Albedo
Intro to Energy and Energy Resources
This episode defines energy and introduces the different energy resources.
Topics covered in this video:
0:00 – 0:26:
– Introduction
0:27 – 4:46 (end)
– Definition of energy
– Different kinds of energy
– Energy transformations
– Efficiency
– Energy resources are found in all spheres of the earth (geosphere, biosphere, hydrosphere, atmosphere, cosmosphere)
Earth’s Carbon Cycle
This episode investigates the Earth’s carbon cycle, and how it has been affected by human activities.
Topics covered in this video:
0:00 – 3:47
– What is carbon?
– Reservoirs (pools and sinks)
– Flux (transfer, processes)
– 3 key fluxes: photosynthesis, respiration, combustion
3:48 – 7:58
– Carbon cycle diagrams
– Reservoirs and fluxes
– Equilibrium over time between fluxes – examples with the ocean and atmosphere
7:59 – 11:43 (end)
– The total amount of carbon has not changed, but has been moved around by humans; no longer in equilibrium
– How carbon fluxes have changed due to humans
Climate Controls: Regional Variations
This episode examines factors that affect regional climate, including altitude, latitude, mountains, proximity to oceans, axial tilts and pressure systems.
Topics covered in this video:
0:00 – 1:05
– Earth’s climate system: the major players
– Fundamental controls of regional climate
1:06 – 4:28
– Axial tilt
– Sun angle and insolation
– Reason for seasons
4:29 – 6:16
– Latitude
– Tropics and how energy is transferred from the tropics to other latitudes
6:17 – 8:48
– Pressure systems
– Basic weather rules
– High and low pressure
– Rising and sinking air, warm and cool air
– Deserts
– Intertropical Convergence Zone (ITCZ)
8:49 – 9:32
– Altitude
9:33 – 10:27
– Mountains – windward and leeward sides
10:28 – 12:39 (end)
– Proximity to large bodies of water
– Land and water heat capacities
– Map of daily mean temperature in July and January
Climate Controls: External Forcings
This episode examines factors that affect regional climate, including altitude, latitude, mountains, proximity to oceans, axial tilts and pressure systems.
Topics covered in this video:
0:00 – 0:15
– Introduction
0:16 – 1:54
– Global factors that affect climate
– External or internal factors? Can these be affected by humans?
– Solar variations
– Orbital variations
– Impacts of extraterrestrial bodies
1:55 – 4:24
– Introduction to the sun
– Solar Variation
– sunspots
– How solar variation affects climate
4:25 – 9:06
– Why solar variations are NOT a major factor in climate change
9:08 – 13:41
– Orbital variations
– Eccentricity
13:42 – 16:52
– Obliquity
– Precession
– Milankovich Theory
16:53 – 18:47 (end)
– Impacts of extraterrestrial bodies
– “K-T Event” on the Yucatan Peninsula
Climate Controls: Internal Forcings – Oceans
This episode explores the role of the ocean on the global climate, including ocean composition and circulation patterns.
Topics covered in this video:
0:00 – 2:41:
– Introduction and Terminology
– Ocean composition and circulation: internal factors that humans can influence
– The Oceans: names and locations
– Antarctica and its ice
2:42 – 6:06
– Sea level controlled by two factors
– Melting/formation of glaciers
– Temperature of sea water
– Map of what the U.S. coastlines used to look like at the end of the last ice age
– Florida, Gulf Coast, and California
6:07 – 8:33
– Ocean composition – salinity and global variability
8:34 – 13:15:
– Connection between ocean pH and atmospheric CO2
– Ocean acidification
– Can humans change the ocean pH back to normal levels?
– The effect of lower pH on marine ecosystems
– Global distribution of coral reefs
13:16 – 16:19: – Ocean circulation and currents
– Driven by two processes: air pressure and density
– Surface currents
– Coriolis effect, Ekman Spiral, and Gyres
16:20 – 20:51 (end):
– Density depends on variations in temperature and salinity
– Temperature variations
– Salinity variations
– Meridional Overturning Circulation (MOC)
– Global Conveyor Belt
– Diagram of the North Atlantic current
– How temperature is distributed due to MOC
Climate Controls: Internal Forcings – Plate Tectonics
This episode explores how plate tectonic affect climate, including the formation of mountains and volcanoes.
Topics covered in this video:
0:00 – 1:18
– mountain building
– volcanic eruptions
– overview of plate tectonics
– plate boundaries
– transform, convergent, divergent
1:19 – 4:32
– how climate is affected by plate tectonics
– lateral movements
– vertical movements
– volcanic eruptions
– how ocean currents are guided by continental boundaries
– Example: climate without the Isthmus of Panama
– oceanic mixing and biological shift
4:33 – 6:52
– surface uplift: mountains and plateaus
– affect on air circulation
– Himalayas and Asian Monsoon
6:53 – 9:21
– volcanic eruptions (subduction zones)
– effect of ash and aerosols
– effect of major erruptions on Earth’s climate
– Tambora Indonesia (1815)
– Pinatubo, Phillippines (1991)
Global Climate Change: Paleoclimate
This episode continues our investigation of current climate change by exploring the climate of the past and the techniques used to do so in present day.
Topics covered in this video:
0:00 – 1:24
– Defining paleoclimate
– Why study paleoclimate?
– Proxies and why they’re used
– What types of proxies are there?
1:25 – 3:02
– Tree rings as proxies
– How they are used
3:03 – 7:59
– Ice cores as proxies
– Isotopes (hydrogen and oxygen), bubbles
– Antarctica and Vostok
– How ice cores are used
– Figure of ice core data
8:00 – 9:36
– Sedimentary particles (fossils and pollen) as proxies
9:37 – 12:58
– Diagnostic rock types
– Coal deposits, salt or gypsum deposits, glaciers
– Evidence of past glaciers
– Moraine, smoothing striations, erratics
12:59 – 18:28 (end)
– Maps showing the extent of ice in North America
– Relation to pine trees receding north
– Pollen trends
– Deglaciation of North America
– Lakes near the edge of glaciers
– Breakout of fresh water to North Atlantic and its effect on the Great Ocean Conveyor Belt (Younger-Dryas cooling)
– Plot of Greenland temperature during the Younger-Dryas cooling
Global Climate Change: Review and Human Impact
This episode reviews how the climate has been undergoing an accelerated change in the last couple hundred years, and it pointsout the evidence that suggests certain human activities are contributing to it.
Topics covered in this video:
0:00 – 3:01
– Greenhouse gas values of CO2, N2O, CH4
– world population growth
– exponential functions
3:02 – 6:44
– acceleration of human activity
– fertilizer consumption
– water use
– foreign investment
– energy use by humans (by era)
6:45 – 8:52
– How some human activities influence climate
– burning fossil fuels
– fertilizers and agriculture
– livestock
– deforestation
– modern technology
Petroleum: Geology & Exploration
This episode summarizes the geology and geography of petroleum and typical exploration and extraction techniques.
Topics covered in this video:
0:00 – 3:51
– History of North America’s first oil wells: Petrolia, ON and Titusville, PA
– “Oil boom” 1860 – 1900
– Movement to Middle East and South America
– Top 5 Countries:
– oil production to date (since ~1860)
– 2011 rate of oil production
– remaining oil reserves
3:52 – 6:55
– Geography of the Middle East
– bodies of water, countries
– contains 60% of the world’s petroleum reserves
– map of oil field locations in the Middle East
– Ghawar
6:56 – 12:38
– Why is oil concentrated in the Middle East?
– Geological explanation
– How to make exploitable petroleum
– source rock – permeability
– diagram of a vertical slice through Earth’s crust
– anticlines, pinchout
12:39 – 17:49 (end)
– Exploration and production steps
– test wells and “primary production” phase — free-flowing petroleum
– secondary recovery, injection wells and how they work
– tertiary recovery, heating oil by injecting steam to reduce viscosity
– Production history of an oil field
The End of the Age of “Easy Oil” Part I
This episode explores the critical energy crisis that modern society faces, also known as “Peak Oil”.
Topics covered in this video:
0:00 – 3:23
– M. King Hubbert (geologist)
– Hubbert Curve
– “Peak Oil” – meaning and public understanding
3:24 – 6:15
– Hubbert prediction of United States peak oil (1970s)
– Discovery of Alaskan oil
– Hubbert’s prediction for global peak oil (1995) “if present trends continue”
6:16 – 11:10
– global oil production 1960 – 2003
– “Bumpy Plateau” of oil production (2004 – present)
11:11 – 12:39
– reaction to Peak Oil from economists, politicians, and oil companies
12:40 – end
– 11 other observations that say this is the end of Easy Oil
– all low-hanging fruit is gone
– Declining discoveries
– Declining giant fields
– Rapid declines in conventional oil fields
– North Sea oil
– North American oil
– Indonesian oil
The End of the Age of “Easy Oil” Part II
This episode talks about the pieces of evidence that indicate that the Age of “Easy Oil” is over. Additionally, unconventional oil resources are explored.
Topics covered in this video:
0:00 – 4:13
– 11 other observations that say this is the end of Easy oil (continued from Part I)
– Collapse of supergiant fields – Mexico’s Contarell (world’s 3rd largest oil field)
– Problematic unconventional reserves – tar sands, oil shale, heavy crude oil
4:14 – 9:39
– more expensive to find and develop petroleum
– huge increase in drilling is not reflected in production
– Workforce shortfall by 2010
– Global demand (Asia)
– Net exports are declining – projections of production, consumption, export, and import by 2020
9:40 – 13:09
– Peak oil in higher, mainstream media
– Fatih Birol: economist of IEA on oil – German military think tank
– U.S. Department of Defense in “Joint Operating Environment 2010”
13:10 – 15:34
– Bob Hirsch, energy advisor and his estimate for decline in energy
– “What’s next?”
– Deepwater Horizons disaster in Gulf of Mexico
15:35 – 17:22
– Figure of global oil production: 0 – 4000 AD
– Low-hanging fruit is gone
– petroleum is nonrenewable: how can we respond to the end of easy oil?
Why do scientists think current climate change is being caused by humans?
The main reason has to do with the fundamental physics of the greenhouse effect. Greenhouse gasses are transparent to solar radiation but are relatively opaque to terrestrial radiation. This means that greenhouse gasses inhibit the Earth’s ability to radiate energy to space. Therefore, all else being equal, a higher atmospheric concentration of greenhouse gasses should work to warm the Earth’s surface. Observations corroborate this idea by showing that the Earth has indeed warmed as the atmospheric concentration of greenhouse gasses like CO2have increased (figure 1).
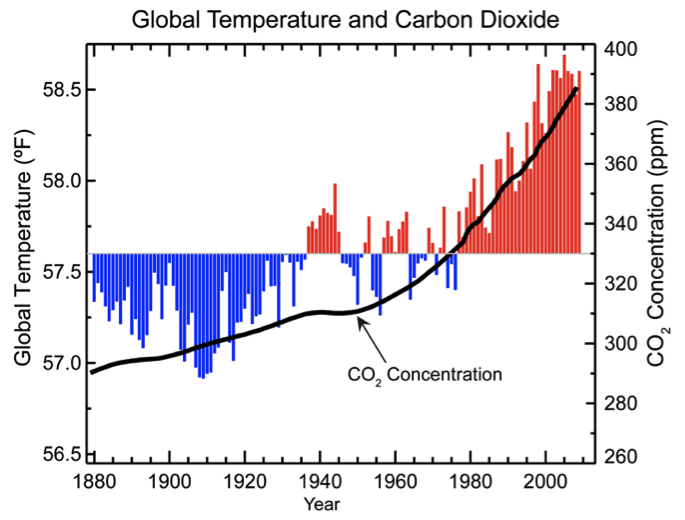
figure 1 – Global temperature and CO2 concentration from 1880-2009 (Source)
In addition to causing warming, an increase in the Earth’s greenhouse effect should cause less infrared energy to escape to space and should cause more infrared energy to return to the Earth’s surface. Both of these effects have been observed (Harries, 2001; Philipona, 2004) which strongly indicates that the warming we are currently experiencing is a result of an enhanced greenhouse effect.
Another reason that scientists think humans are responsible for the current warming is that there is no satisfactory natural explanation. Past climate changes that have to do with plate tectonics and orbital forcings are too slow to be responsible while changes in solar brightness and volcanic activity are not sufficient to account for the observed warming. This idea can be demonstrated with climate models which are mathematical representations of the Earth’s climate run on supercomputers. When known changes in solar brightness and volcanic activity are included in climate models, they do a good job of reproducing much of climate variability over the past 1000 years. However, climate models cannot reproduce the recent warming that we have observed unless they include the dramatic increase in the atmospheric concentration of greenhouse gasses (figure 2).
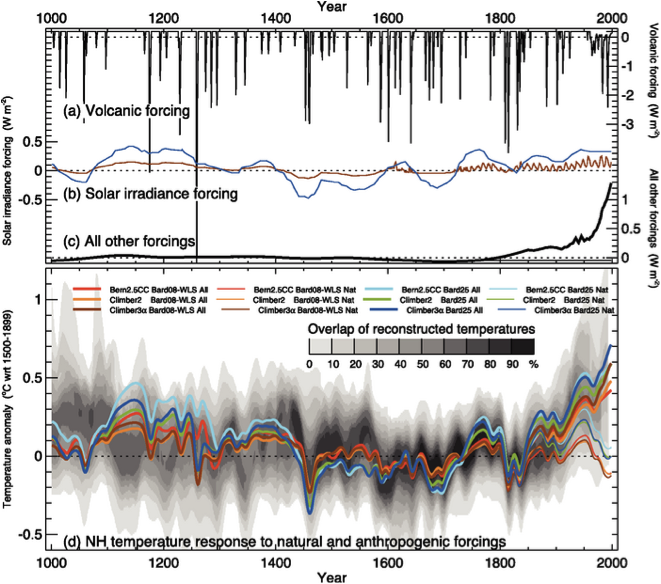
figure 2 – Top: Major causes of Northern Hemisphere temperature changes over the last 1000 years.
Bottom: reconstructed temperature changes over the last 1000 years (grey shading) and climate model simulations of temperature changes over the past 1000 years (colored lines). The thin colored lines represent simulations that did not include increased greenhouse gas concentrations during the 19th and 20th centuries while the thick colored lines represent simulation that did include increased greenhouse gas concentrations during the 19th and 20th centuries. Notice how only the simulations that include greenhouse gas increases can reproduce the observed warming at the end of the period. (Source)
Further Reading:
NASA Global Climate Change Causes
References:
Harries J.E., H. E. Brindley, P. J. Sagoo and R. J. Bantges (2001), Increases in greenhouse forcing inferred from the outgoing longwave radiation spectra of the Earth in 1970 and 1997, Nature 410, 355-357, doi:10.1038/35066553
Philipona, R., B. Dürr, C. Marty, A. Ohmura, and M. Wild (2004), Radiative forcing ‐ measured at Earth’s surface ‐ corroborate the increasing greenhouse effect, Geophys. Res. Lett., 31, L03202, doi:10.1029/2003GL018765.
Past Climate Change
The Earth’s climate over the last 4 billion years has changed many times. The swings between warmer and cooler climates are well documented from records such as ice cores or the thickness of tree rings, and indicate that periods of warm and cold climates can last for hundreds or thousands of years.1 These records also indicate that seemingly small changes in global temperature are the difference between an ice age and warmer periods like today. For example, 20,000 years ago, Earth’s average temperature was about 8 degrees F (4.4 degrees C) colder than it is today. That was during our last ice age, when North America was largely covered with ice.2 Step back a further 100,000 years, and the temperature of the Earth was warmer by about 3 degrees F (1.6 degrees C). Most of the Earth’s ice had retreated toward the poles, and sea level was at least twenty feet (6 m) higher than today. 3 So based on historical records, a few degrees difference in the Earth’s global temperature can have a big impact on the planet.
References
1. The use of tree rings, ice cores, coral reefs, and even historical records such as the time of grape harvest all provide information about the past climate. Information from the NOAA paleoclimatology division provides a good introduction. https://www.ncdc.noaa.gov/paleo/paleo.htmll, accessed May 8, 2008.
2. The last ice age was caused by a decline (2 watts/m 2 ) in the surface radiation budget due to orbital variations and feedbacks associated with carbon dioxide and ice sheets. See chapter 6 of the 2007 IPCC report and references therein for details. IPCC, Climate Change 2007: The Physical Science Basis: Contribution of Working Group 1 to the Fourth Assessment Report on the Intergovernmental Panel on Climate Change, S. Solomon, et al., eds. (Cambridge: Cambridge University Press, 2007), https://www.ipcc.ch/report/ar4/wg1/, accessed May 8, 2008.
3. These data come from the Vostok ice-core temperature reconstruction. You can look at the raw data yourself if you are curious to see how temperature has changed over the last 400,000 years, https://cdiac.ess-dive.lbl.gov/trends/temp/vostok/jouz_tem.htm,
or for a good plot of temperature and carbon dioxide over the last 650,000 years, see Figure TS.1. from the 2007 IPCC report. IPCC, Solomon, et al. (2007).